
How we did this month—2019
View the most recent monthly client call statistics from the Government of Canada Pension Centre
The Pension Centre’s service standard to answer telephone calls is within 180 seconds. However, please note that circumstances beyond their control may result in longer wait times occasionally.
December
Calls answered within 180 seconds?
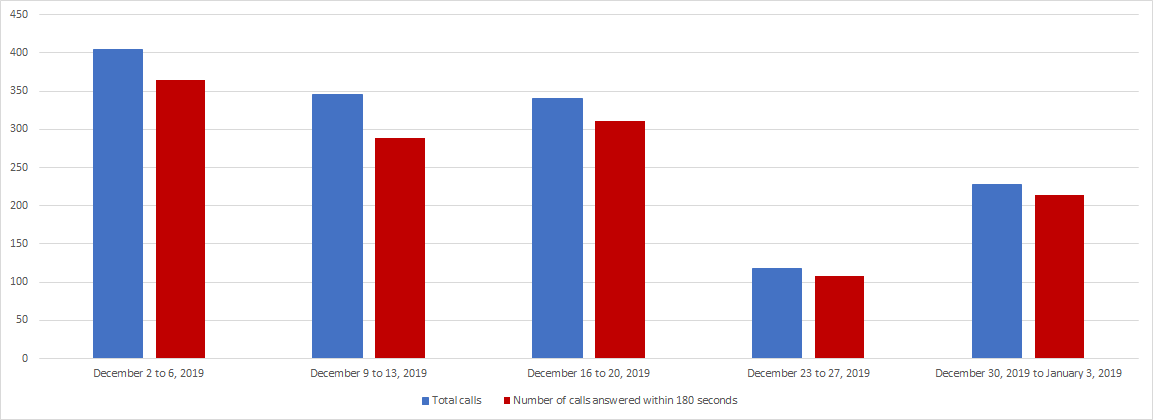
The graph and table that follow show the weekly average number of calls that we answered within 180 seconds in December.
| Date | Total calls | Number of calls answered within 180 sec |
|---|---|---|
| December 2 to 6, 2019 | 405 | 364 |
| December 9 to 11, 2019 | 345 | 289 |
| December 16 to 20, 2019 | 340 | 311 |
| December 23 to 27, 2019 | 118 | 108 |
| December 30, 2019 to January 3, 2019 | 228 | 214 |
Average call wait time December 2019
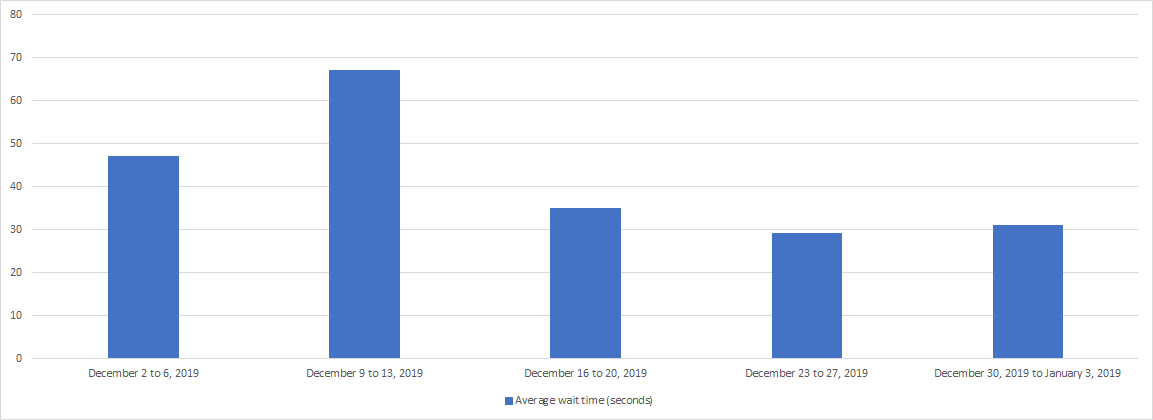
The graph and table that follow show the weekly average number of calls that we answered within 180 seconds in December.
| Date | Average wait time (seconds) |
|---|---|
| December 2 to 6, 2019 | 47 |
| December 9 to 11, 2019 | 67 |
| December 16 to 20, 2019 | 35 |
| December 23 to 27, 2019 | 29 |
| December 30, 2019 to January 3, 2019 | 31 |
November
Calls answered within 180 seconds?
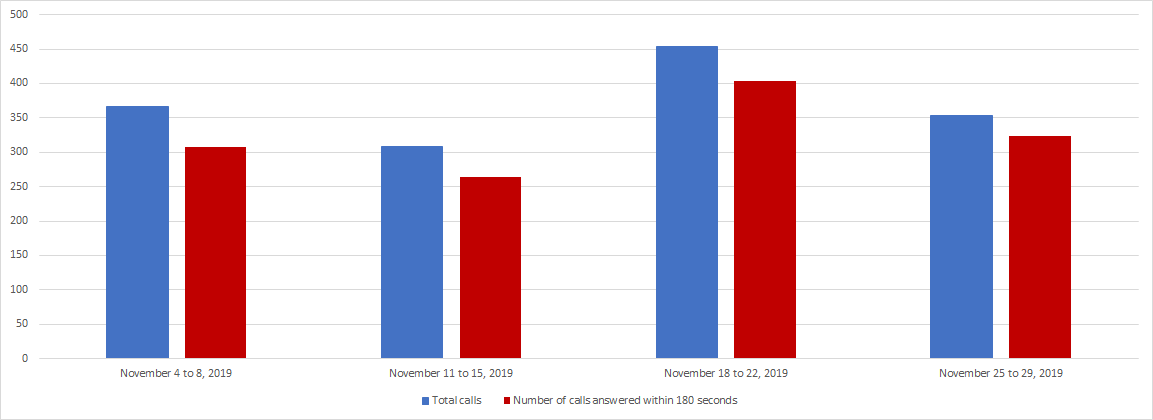
The graph and table that follow show the weekly average number of calls that we answered within 180 seconds in November.
| Date | Total calls | Number of calls answered within 180 sec |
|---|---|---|
| November 4 to 8, 2019 | 366 | 308 |
| November 11 to 15, 2019 | 308 | 264 |
| November 18 to 22, 2019 | 453 | 403 |
| November 25 to 29, 2019 | 354 | 323 |
Average call wait time November 2019
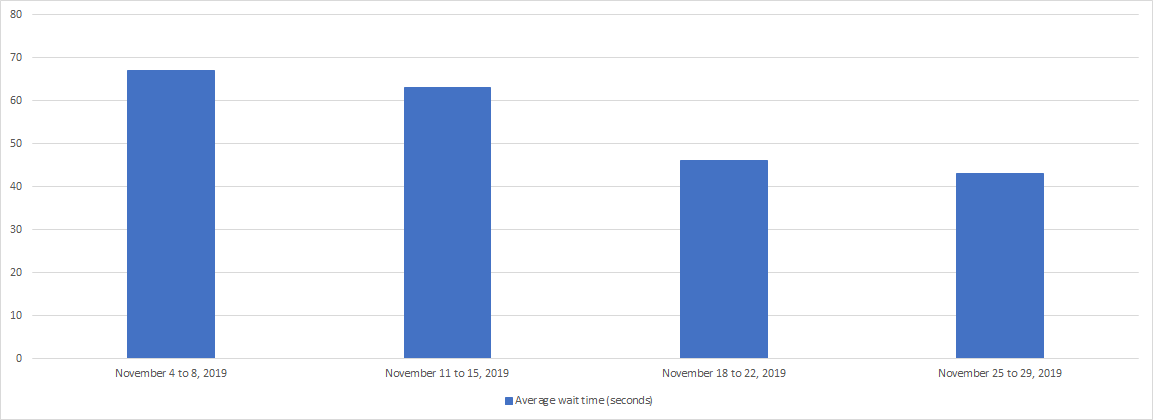
The graph and table that follow show the weekly average number of calls that we answered within 180 seconds in November.
| Date | Average wait time (seconds) |
|---|---|
| November 4 to 8, 2019 | 67 |
| November 11 to 15, 2019 | 63 |
| November 18 to 22, 2019 | 46 |
| November 25 to 29, 2019 | 43 |
October
Calls answered within 180 seconds?
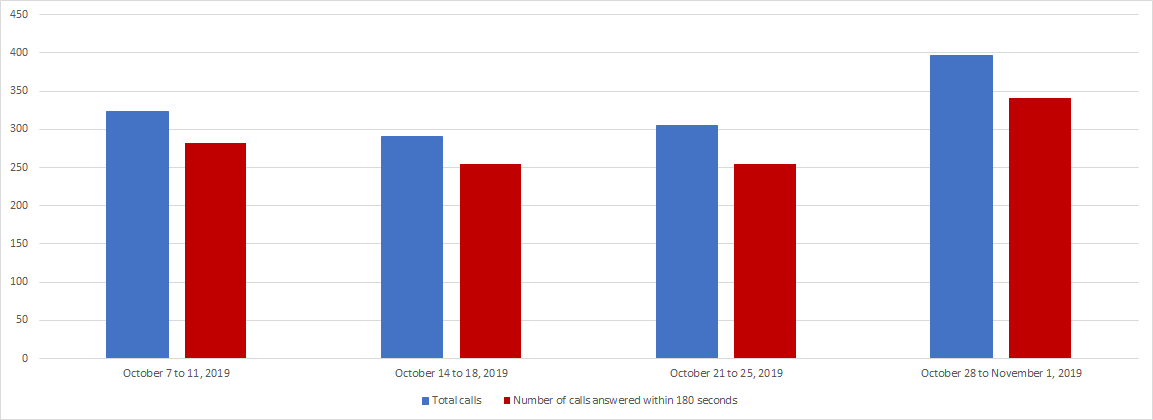
The graph and table that follow show the weekly average number of calls that we answered within 180 seconds in October.
| Date | Total calls | Number of calls answered within 180 sec |
|---|---|---|
| October 7 to 11, 2019 | 323 | 282 |
| October 14 to 18, 2019 | 291 | 255 |
| October 21 to 25, 2019 | 305 | 255 |
| October 28 to November 1, 2019 | 396 | 341 |
Average call wait time October 2019
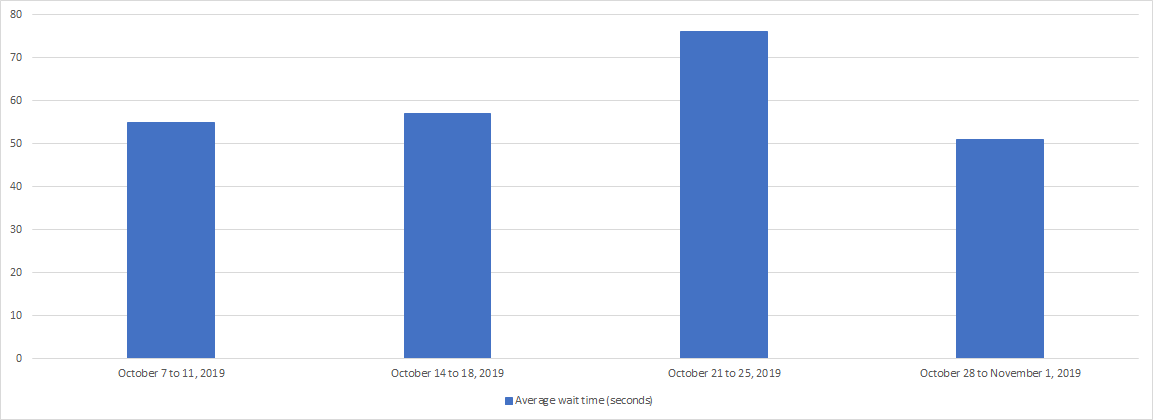
The graph and table that follow show the weekly average number of calls that we answered within 180 seconds in October.
| Date | Average wait time (seconds) |
|---|---|
| October 7 to 11, 2019 | 55 |
| October 14 to 18, 2019 | 57 |
| October 21 to 25, 2019 | 76 |
| October 28 to November 1, 2019 | 51 |
September
Calls answered within 180 seconds?
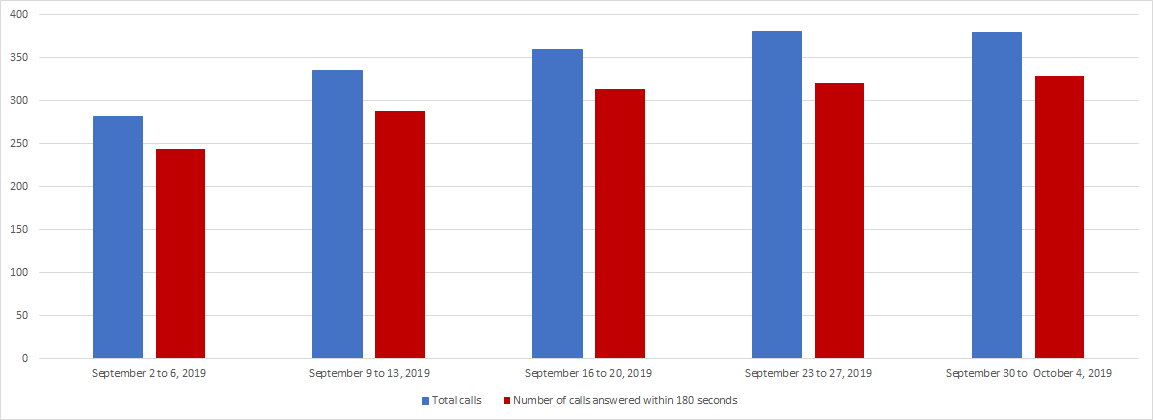
The graph and table that follow show the weekly average number of calls that we answered within 180 seconds in September.
| Date | Total calls | Number of calls answered within 180 sec |
|---|---|---|
| September 2 to 6, 2019 | 281 | 244 |
| September 9 to 13, 2019 | 335 | 288 |
| September 16 to 20, 2019 | 359 | 313 |
| September 23 to 27, 2019 | 380 | 320 |
| September 30 to October 4, 2019 | 379 | 329 |
Average call wait timeSeptember 2019
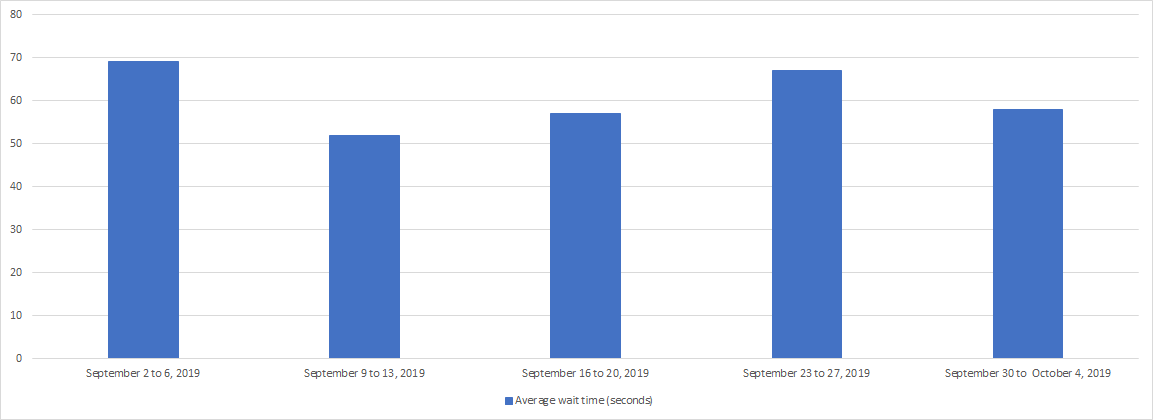
The graph and table that follow show the weekly average number of calls that we answered within 180 seconds in September.
| Date | Average wait time (seconds) |
|---|---|
| September 2 to 6, 2019 | 69 |
| September 9 to 12, 2019 | 52 |
| September 16 to 20, 2019 | 57 |
| September 23 to 27, 2019 | 67 |
| September 30 to October 4, 2019 | 58 |
August
Calls answered within 180 seconds?
The graph and table that follow show the weekly average number of calls that we answered within 180 seconds in August.
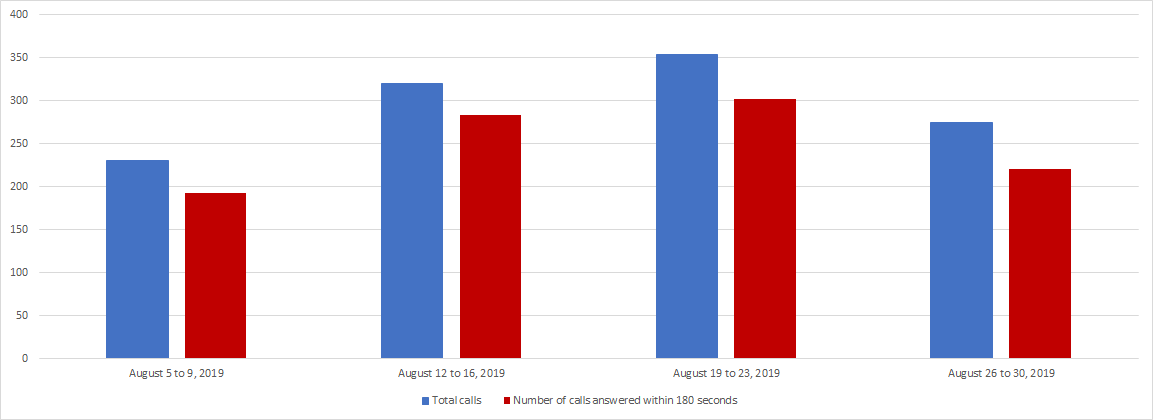
| Date | Total calls | Number of calls answered within 180 sec |
|---|---|---|
| August 5 to 9, 2019 | 230 | 192 |
| August 12 to 16, 2019 | 320 | 283 |
| August 19 to 23, 2019 | 354 | 302 |
| August 26 to 30, 2019 | 274 | 221 |
Average call wait timeAugust 2019
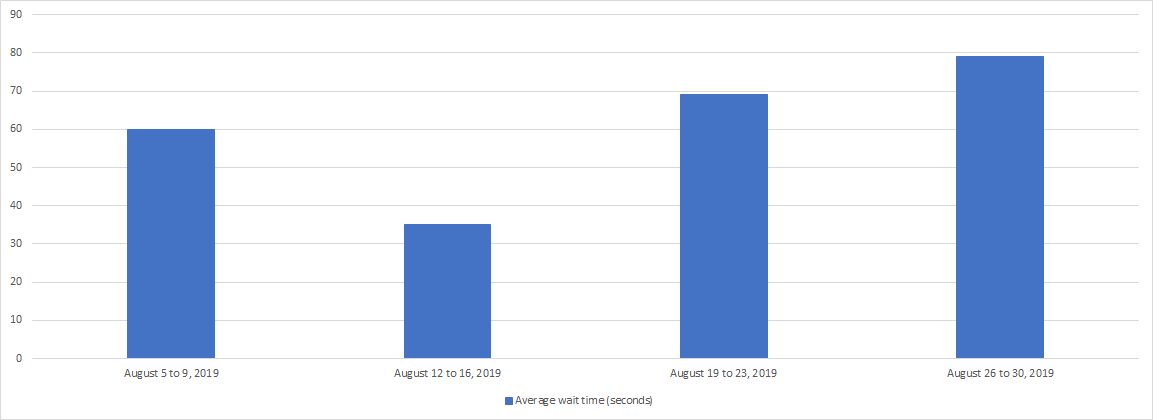
The graph and table that follow show the weekly average number of calls that we answered within 180 seconds in August.
| Date | Average wait time (seconds) |
|---|---|
| August 5 to 9, 2019 | 60 |
| August 12 to 19, 2019 | 35 |
| August 19 to 23, 2019 | 69 |
| August 26 to 30, 2019 | 79 |
July
Calls answered within 180 seconds?
The graph and table that follow show the weekly average number of calls that we answered within 180 seconds in July.
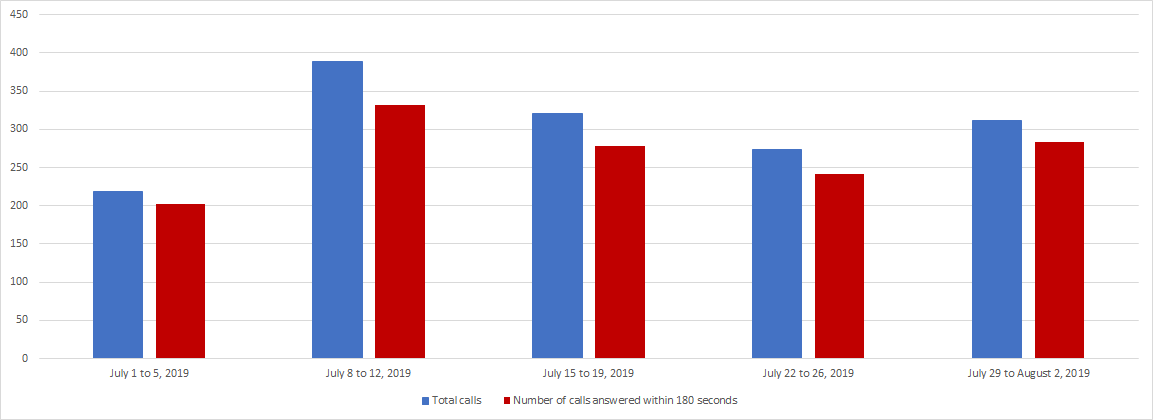
| Date | Total calls | Number of calls answered within 180 sec |
|---|---|---|
| July 1 to 5, 2019 | 219 | 202 |
| July 8 to 12, 2019 | 389 | 332 |
| July 15 to 19, 2019 | 321 | 278 |
| July 22 to 26, 2019 | 273 | 242 |
| July 29 to Aug 2, 2019 | 311 | 284 |
Average call wait timeJuly 2019
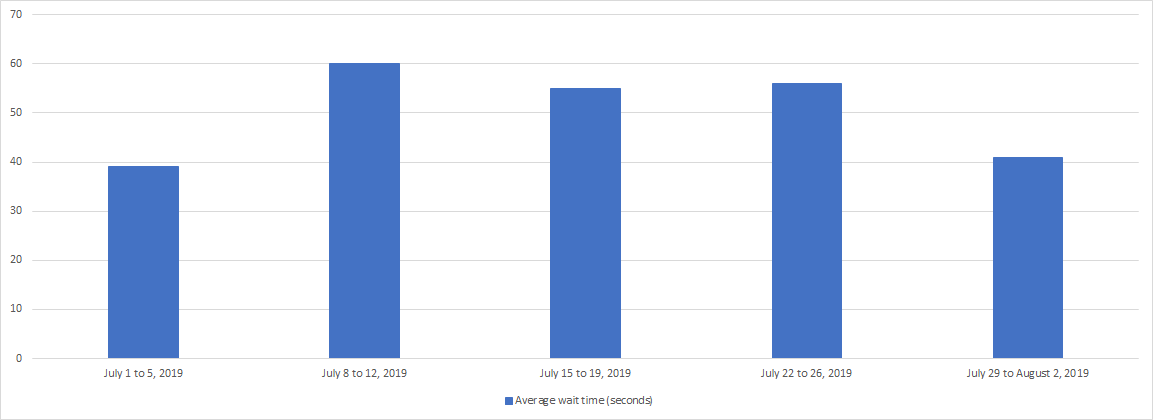
The graph and table that follow show the weekly average number of calls that we answered within 180 seconds in July.
| Date | Average wait time (seconds) |
|---|---|
| July 1 to 5, 2019 | 39 |
| July 8 to 12, 2019 | 60 |
| July 15 to 19, 2019 | 55 |
| July 22 to 26, 2019 | 56 |
| July 29 to Aug 2, 2019 | 41 |
June
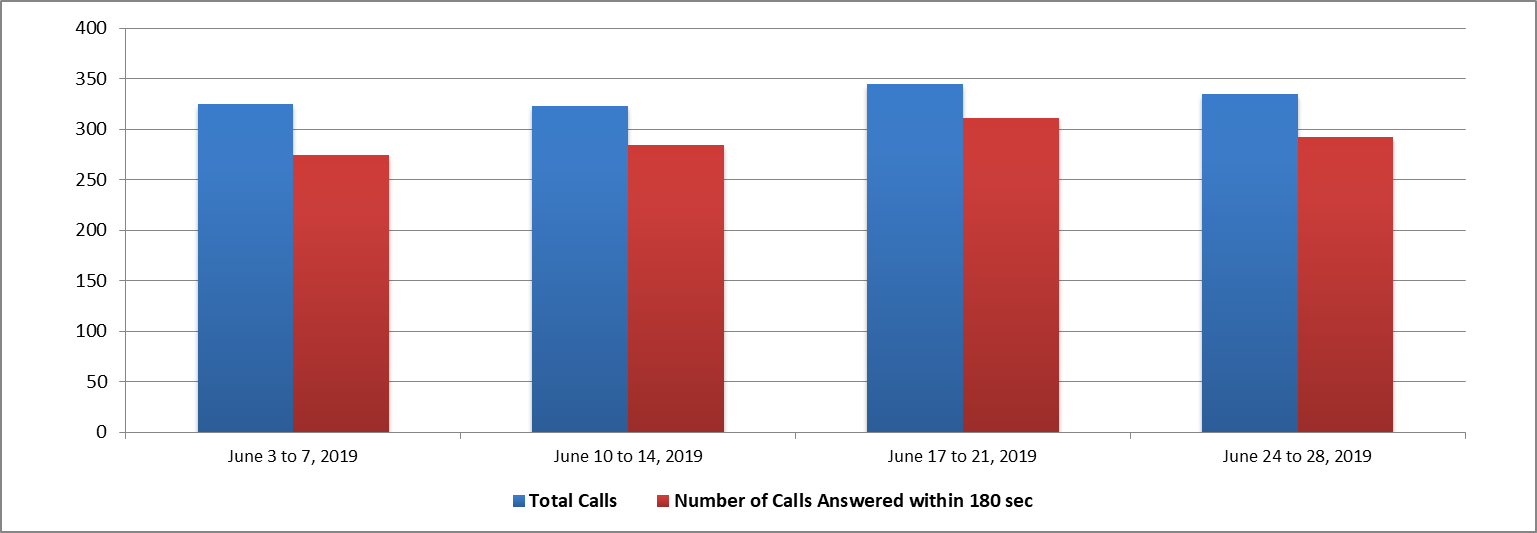
Calls answered within 180 seconds?
The graph and table that follow show the weekly average number of calls that we answered within 180 seconds in June.
| Date | Total calls | Number of calls answered within 180 sec |
|---|---|---|
| June 3 to 7, 2019 | 325 | 275 |
| June 10 to 14, 2019 | 323 | 284 |
| June 17 to 21, 2019 | 345 | 311 |
| June 24 to 28, 2019 | 335 | 292 |
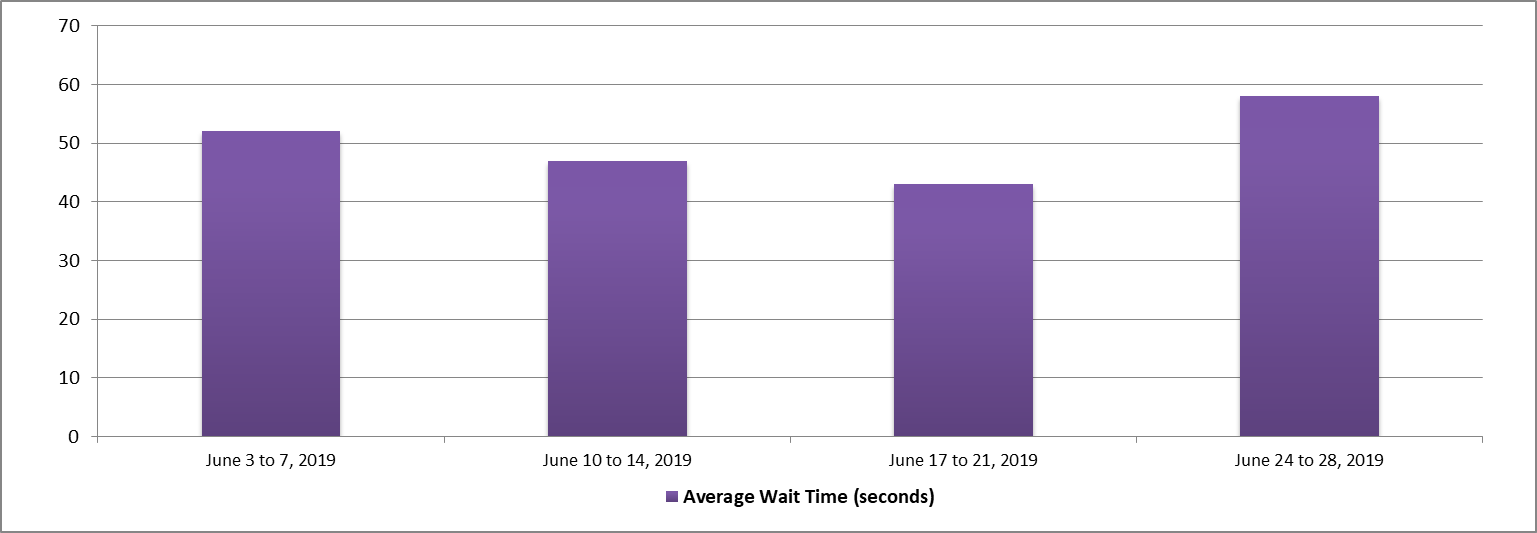
Average call wait timeJune 2019
The graph and table that follow show the weekly average number of calls that we answered within 180 seconds in June.
| Date | Average wait time (seconds) |
|---|---|
| June 3 to 7, 2019 | 52 |
| June 10 to 14, 2019 | 47 |
| June 17 to 21, 2019 | 43 |
| June 24 to 28, 2019 | 58 |
May
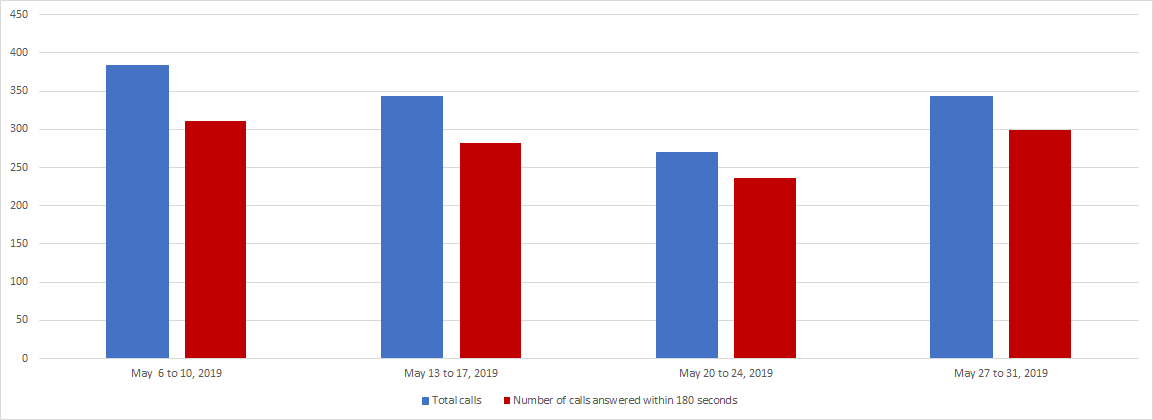
Calls answered within 180 seconds?
The graph and table that follow show the weekly average number of calls that we answered within 180 seconds in May.
| Date | Total calls | Number of calls answered within 180 sec |
|---|---|---|
| May 6 to 10, 2019 | 383 | 311 |
| May 13 to 17, 2019 | 343 | 282 |
| May 20 to 24, 2019 | 270 | 236 |
| May 27 to 31, 2019 | 343 | 299 |
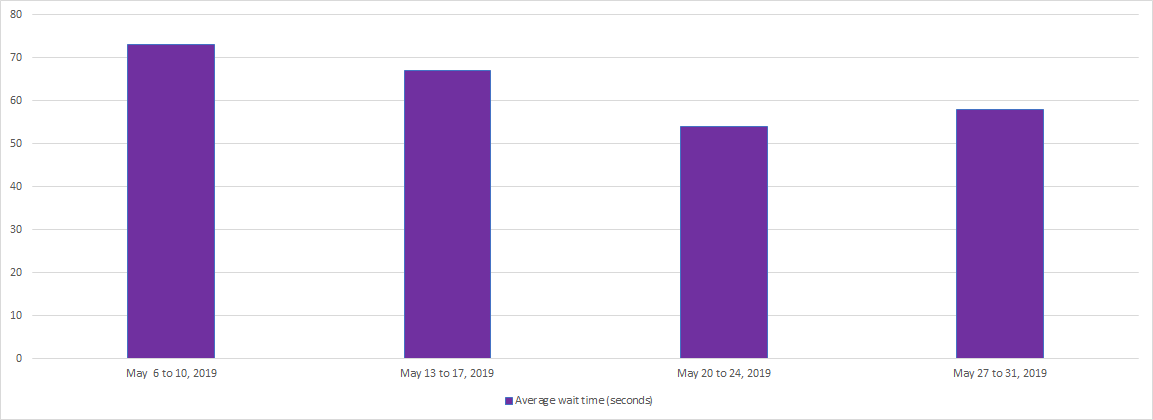
Average call wait timeMay 2019
The graph and table that follow show the weekly average number of calls that we answered within 180 seconds in May.
| Date | Average wait time (seconds) |
|---|---|
| May 6 to 10, 2019 | 73 |
| May 13 to 17, 2019 | 67 |
| May 20 to 24, 2019 | 54 |
| May 27 to 31, 2019 | 58 |
April
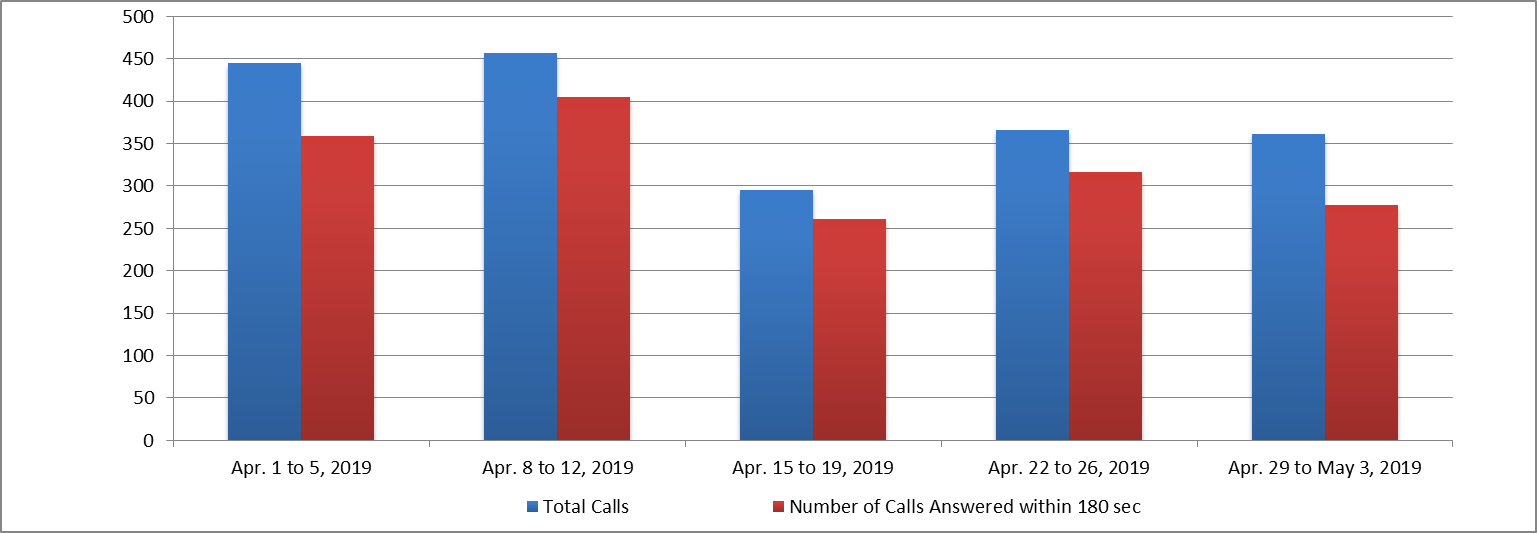
Calls answered within 180 seconds?
The graph and table that follow show the weekly average number of calls that we answered within 180 seconds in April.
| Date | Total Calls | Number of Calls Answered within 180 sec |
|---|---|---|
| April 1 to 5, 2019 | 445 | 359 |
| April 8 to 12, 2019 | 457 | 405 |
| April 15 to 19, 2019 | 295 | 261 |
| April 22 to 26, 2019 | 366 | 317 |
| April 29 to May 3, 2019 | 361 | 277 |
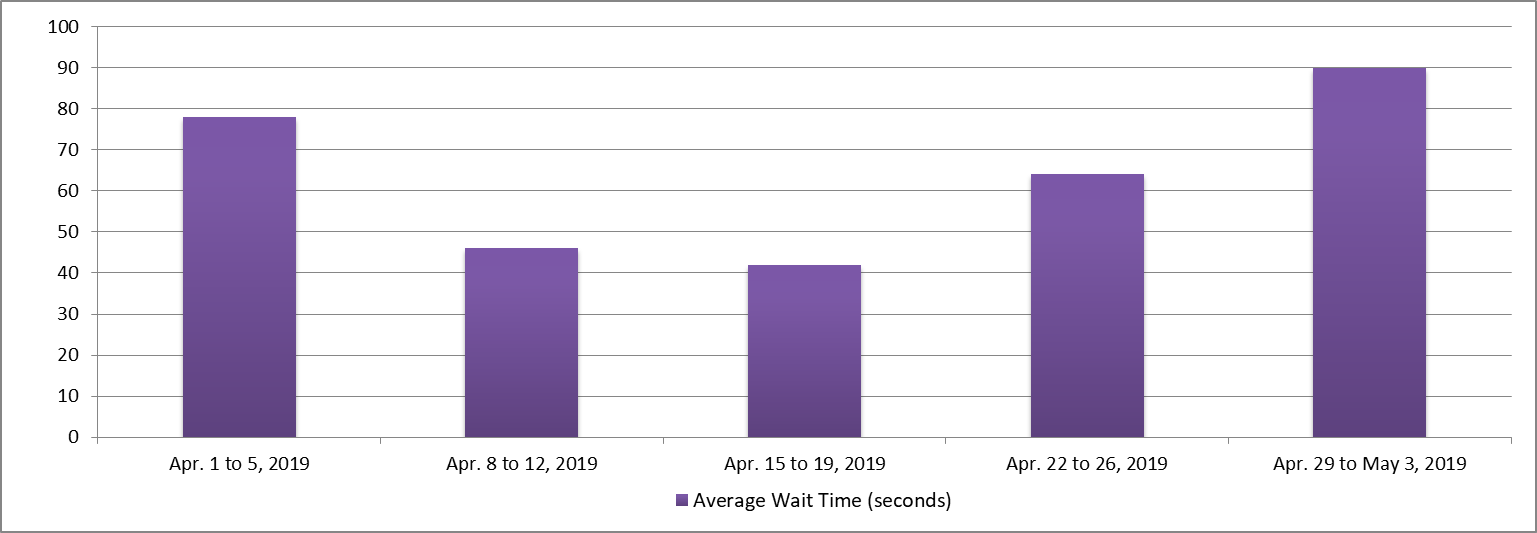
Average call wait timeApril 2019
The graph and table that follow show the weekly average number of calls that we answered within 180 seconds in April.
| Date | Average Wait Time (seconds) |
|---|---|
| April 1 to 5, 2019 | 78 |
| April 8 to 12, 2019 | 46 |
| April 15 to 19, 2019 | 42 |
| April 22 to 26, 2019 | 64 |
| April 29 to May 3, 2019 | 90 |
March
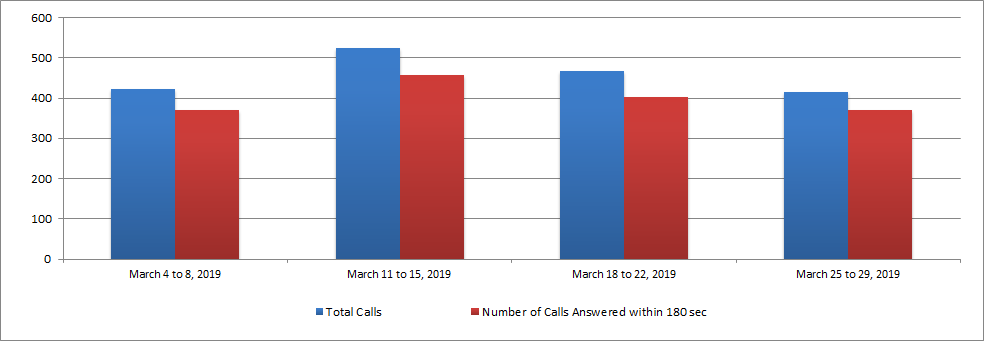
Calls answered within 180 seconds?
The graph and table that follow show the weekly average number of calls that we answered within 180 seconds in March.
| Date | Total Calls | Number of Calls Answered within 180 sec |
|---|---|---|
| March 4 to 8, 2019 | 422 | 371 |
| March 11 to 15, 2019 | 523 | 456 |
| March 18 to 22, 2019 | 467 | 403 |
| March 25 to 29, 2019 | 415 | 369 |
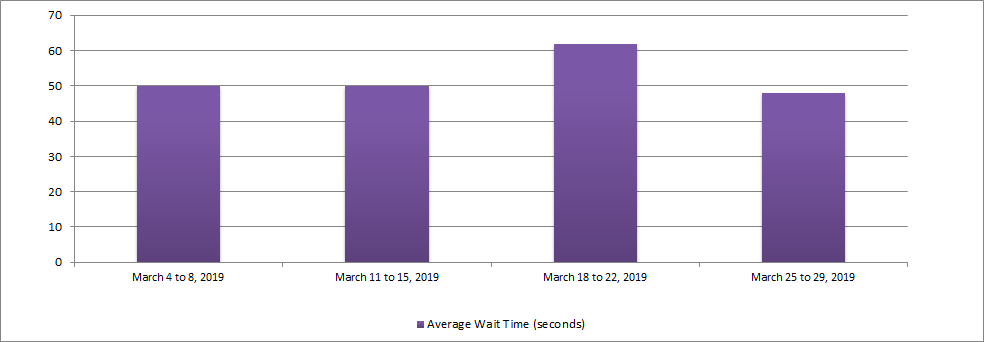
Average call wait time March 2019
The graph and table that follow show the weekly average number of calls that we answered within 180 seconds in March.
| Date | Average Wait Time (seconds) |
|---|---|
| March 4 to 8, 2019 | 50 |
| March 11 to 15, 2019 | 50 |
| March 18 to 22, 2019 | 62 |
| March 25 to 29, 2019 | 48 |
February
Calls answered within 180 seconds?
The graph and table that follow show the weekly average number of calls that we answered within 180 seconds in February.
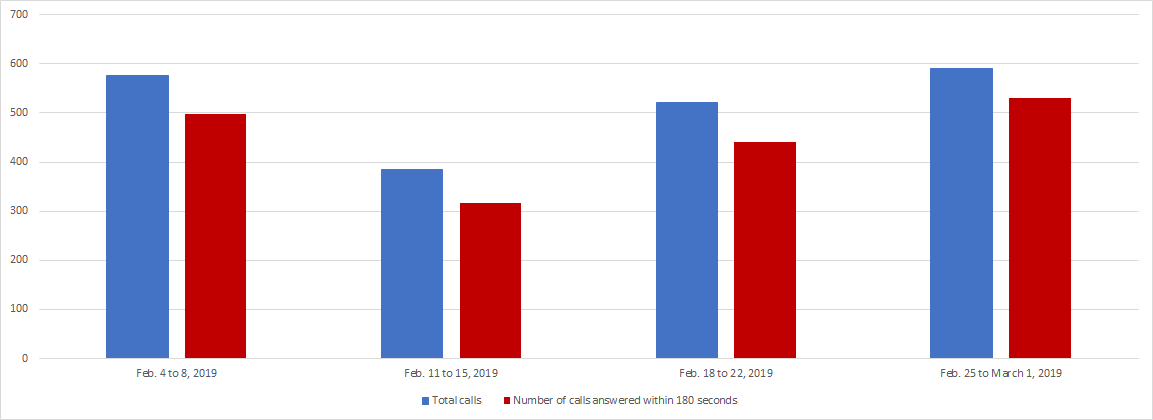
| Date | Total Calls | Number of Calls Answered within 180 sec |
|---|---|---|
| Feb. 4 to 8, 2019 | 577 | 498 |
| Feb. 11 to 15, 2019 | 385 | 317 |
| Feb. 18 to 22, 2019 | 521 | 440 |
| Feb. 28 to March 1, 2019 | 591 | 530 |
Average call wait time February 2019
The graph and table that follow show the weekly average number of calls that we answered within 180 seconds in February.
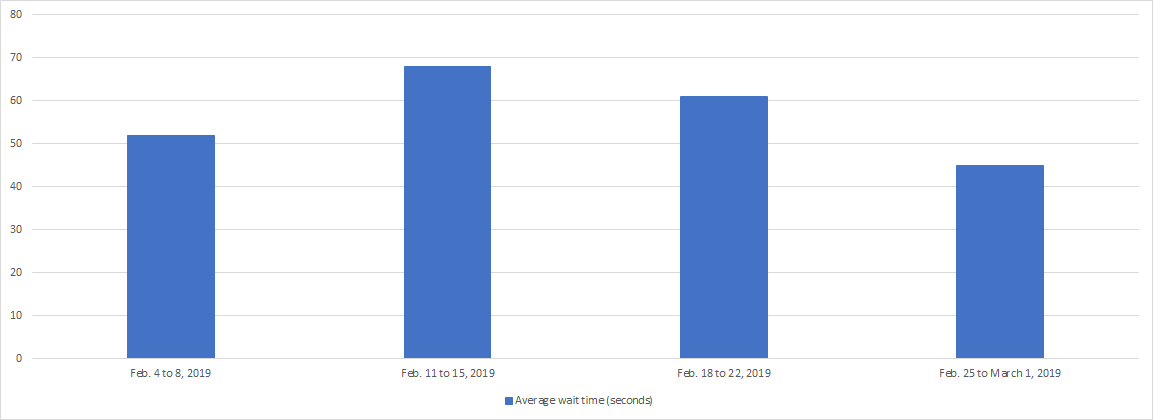
| Date | Average Wait Time (seconds) |
|---|---|
| Feb. 4 to 8, 2019 | 52 |
| Feb. 11 to 15, 2019 | 68 |
| Feb. 18 to 22, 2019 | 61 |
| Feb. 25 to March 1, 2019 | 45 |
January
Calls answered within 180 seconds?
The graph and table that follow show the weekly average number of calls that we answered within 180 seconds in January.
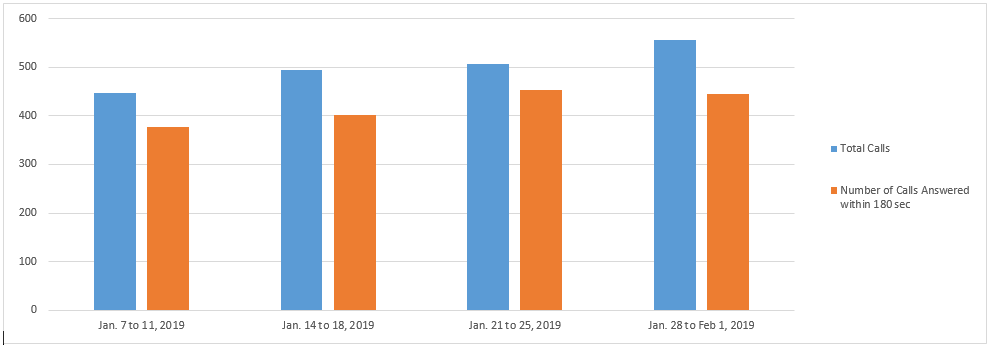
| Date | Total Calls | Number of Calls Answered within 180 sec |
|---|---|---|
| Jan. 7 to 11, 2019 | 447 | 377 |
| Jan. 14 to 18, 2019 | 495 | 401 |
| Jan. 21 to 25, 2019 | 506 | 453 |
| Jan. 28 to Feb. 1, 2019 | 555 | 445 |
Average call wait time January 2019
The graph and table that follow show the weekly average number of calls that we answered within 180 seconds in January.
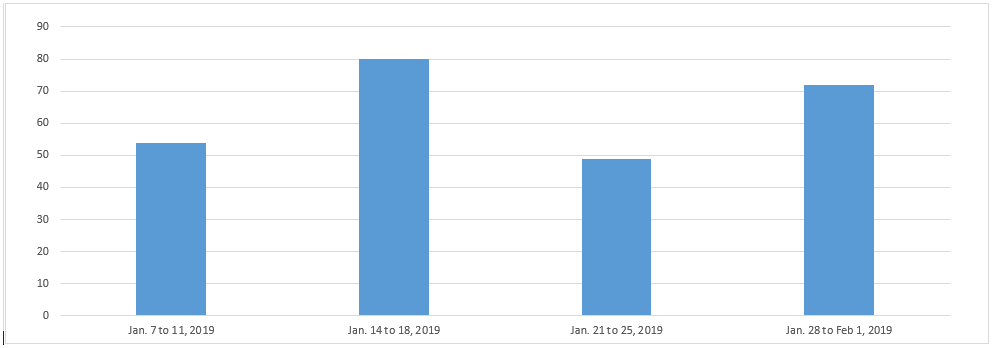
| Date | Average Wait Time (seconds) |
|---|---|
| Jan. 7 to 11, 2019 | 54 |
| Jan. 14 to 18, 2019 | 80 |
| Jan. 21 to 25, 2019 | 49 |
| Jan. 28 to Feb. 01, 2019 | 72 |